ArcGIS Hub
Work together with internal and external stakeholders to track progress, improve outcomes, and create vibrant communities.

Take a geographic approach to protect our environment and natural resources
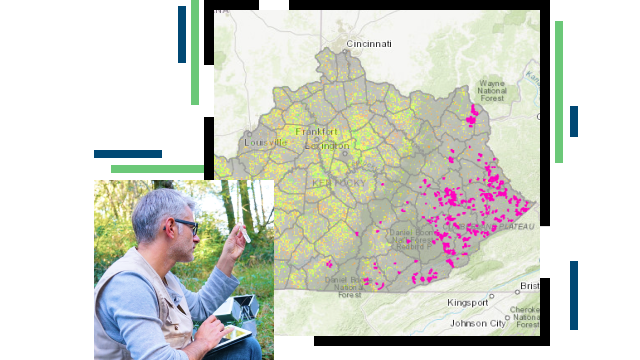
Environmental agencies are tasked with keeping our environment and natural resources safe through environmental regulation. They use GIS to assess project impacts, inform and implement environmental policy, facilitate community engagement, monitor assets in real time, and provide transparency for better outcomes for all people. A geographic approach allows agencies to track the health of the environment, assess environmental justice, identify the source of pollutants, and prevent environmental hazards from contributing to a disaster.
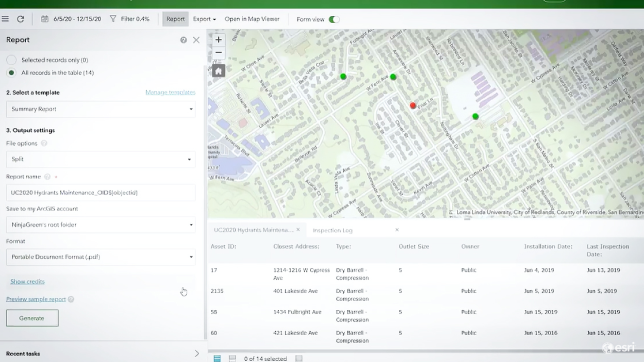
Environmental agencies can ensure compliance by streamlining business processes. With GIS, staff can conduct paperless inspections offline, monitor assets remotely in real time, assess the status of processes, and automate tasks.
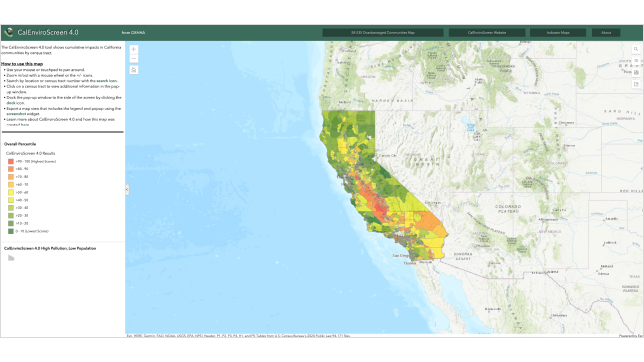
With GIS, environmental agencies can analyze when, where, and how environmental burdens occur. Location-based technology allows this information to be combined with demographic data to show disproportionate impacts on communities, promote environmental equity, and engage the public on these important topics.
Environmental agencies can use GIS to communicate dynamic environmental policies and permitting requirements no matter where a project is located. Agencies can use and share tools to assist project planners, consultants, and others to collect and analyze data, apply for permits, and conduct follow-up inspections in the field.
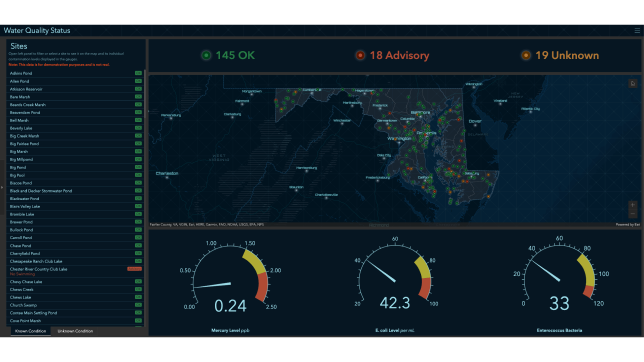
Environmental agencies use real-time apps and dashboards to easily understand critical information about environmental quality, such as air and water purity. Using GIS to explore complex datasets allows environmental agencies to easily uncover significant patterns, trends, correlations, and relationships.
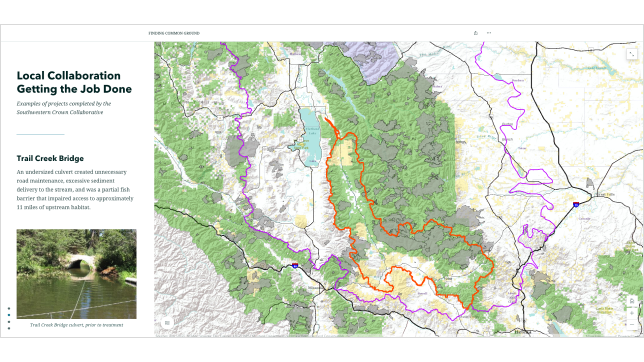
Agencies can use ArcGIS StoryMaps and other mapping apps to easily communicate the potential benefits of projects as well as their impacts and outcomes on the environment with the public, executives, and other agencies. These location-based tools enable users to quickly measure and report on outcomes and progress.
BLOG
Montana’s Department of Natural Resources and Conservation employs maps and dashboards to add transparency to the distribution of stimulus funds.
Read the storyBLOG
GIS empowers the Kentucky Energy and Environment Cabinet to find sites for solar energy projects while protecting communities and the environment.
Read the storyARTICLE
Water management staff save time and money conducting boat inspections with ArcGIS Survey123.
Read the articleARTICLE
The Watershed Agricultural Council visualized and analyzed the extent of logging and its water quality impacts in the New York City Watershed.
Read the articleBLOG
The Kentucky Energy and Environment Cabinet, Division of Water makes data about water quality much more accessible via an interactive map-based site.
Read the storyBLOG
CalEnviroScreen, a project of the California Environmental Protection Agency, reveals which communities have the highest pollution burden.
Read the storyWork together with internal and external stakeholders to track progress, improve outcomes, and create vibrant communities.
Easily consume, visualize, and analyze streaming data in real time from sensor networks within the Internet of Things (IoT).
Optimize resource allocation decisions by using this web application to prioritize projects that benefit communities with the greatest need.
Configure surveys and capture data anytime, anywhere, on any device and analyze responses in real time.
Evaluate and understand environmental impacts of proposed development projects and solicit feedback from stakeholders.
Share progress made on the United Nations (UN) Sustainable Development Goals and their key indicators with the public and other stakeholders.
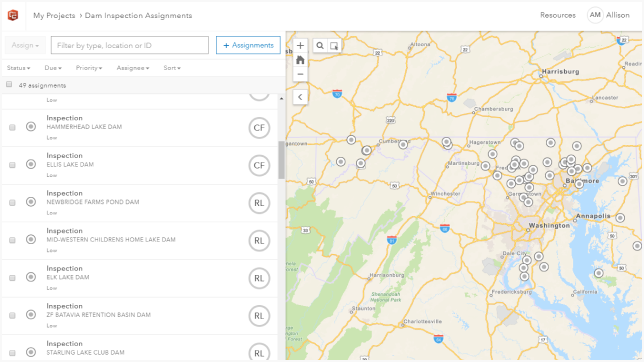
Dam safety staff can make routine inspections, manage work assignments, and monitor inspection programs.