
Visualization
See real-time big data in context
Make informed decisions by mapping real-time big data.
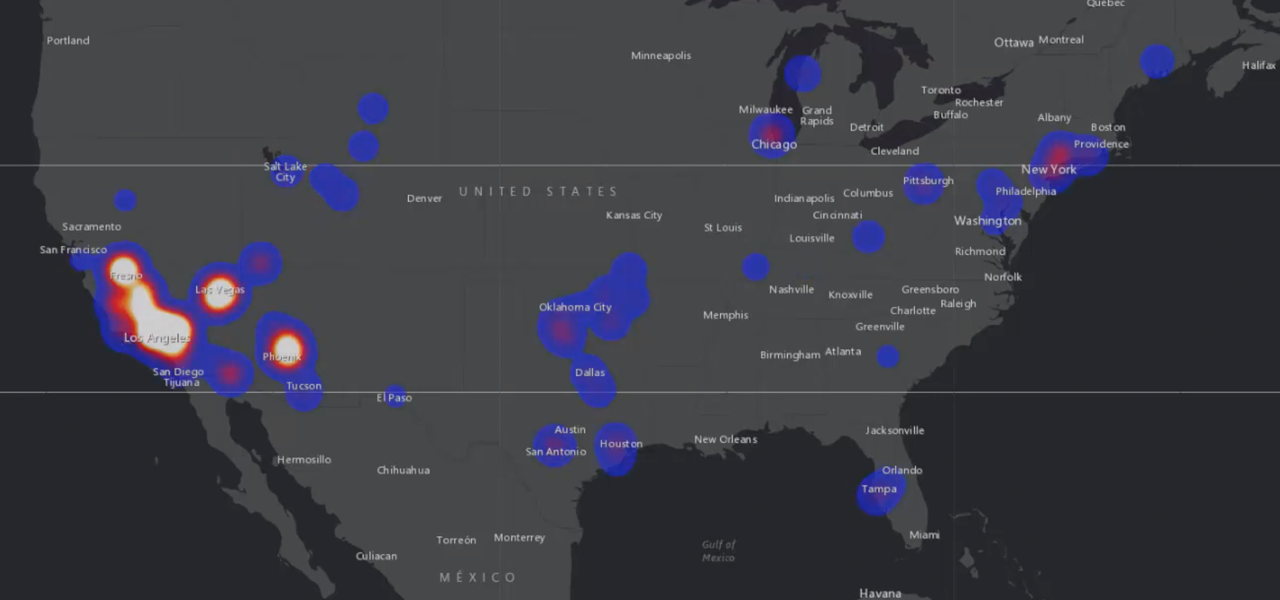
On-the-fly aggregation
Have streaming data? We've got the configurable inputs for any kind of data. Be it stationary sensors such as weather stations, moving assets such as vehicles, or point-in-time events like crime and accidents, ArcGIS GeoEvent Server and ArcGIS Velocity can receive and analyze events from that data stream.
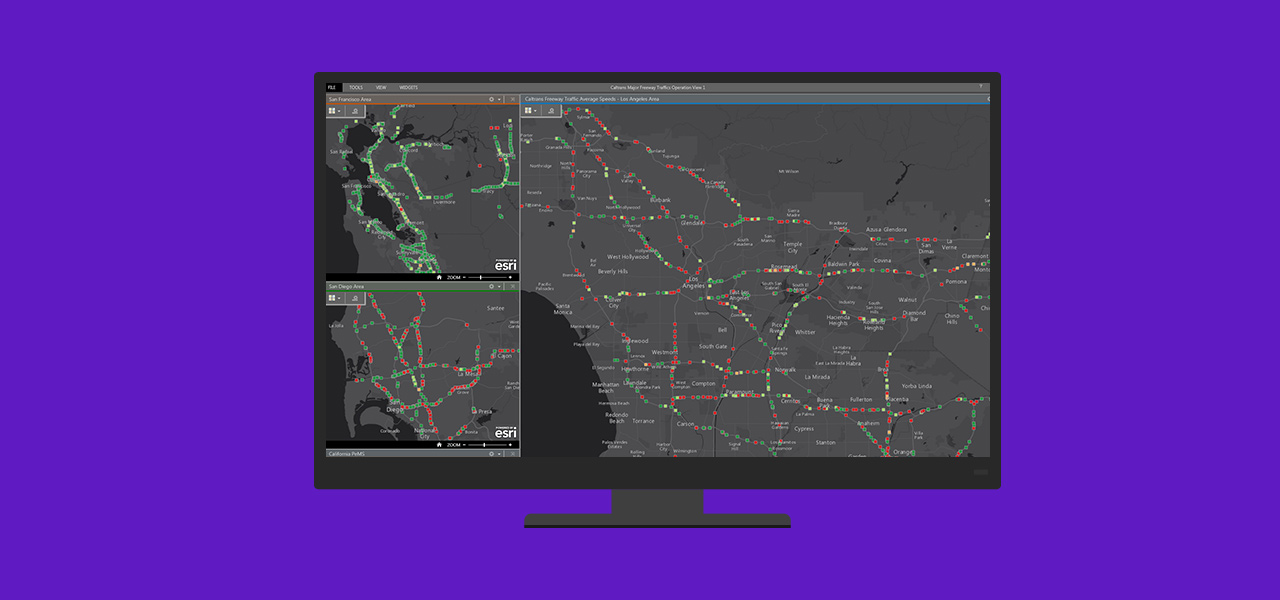
Operational dashboards
Visualize your IoT data on a dynamic dashboard with charts, gauges, maps, and other visual elements that show the status and performance of vital assets and events in real time. Operations Dashboard for ArcGIS is the perfect tool to deliver a complete operating picture of your real-time, big data.
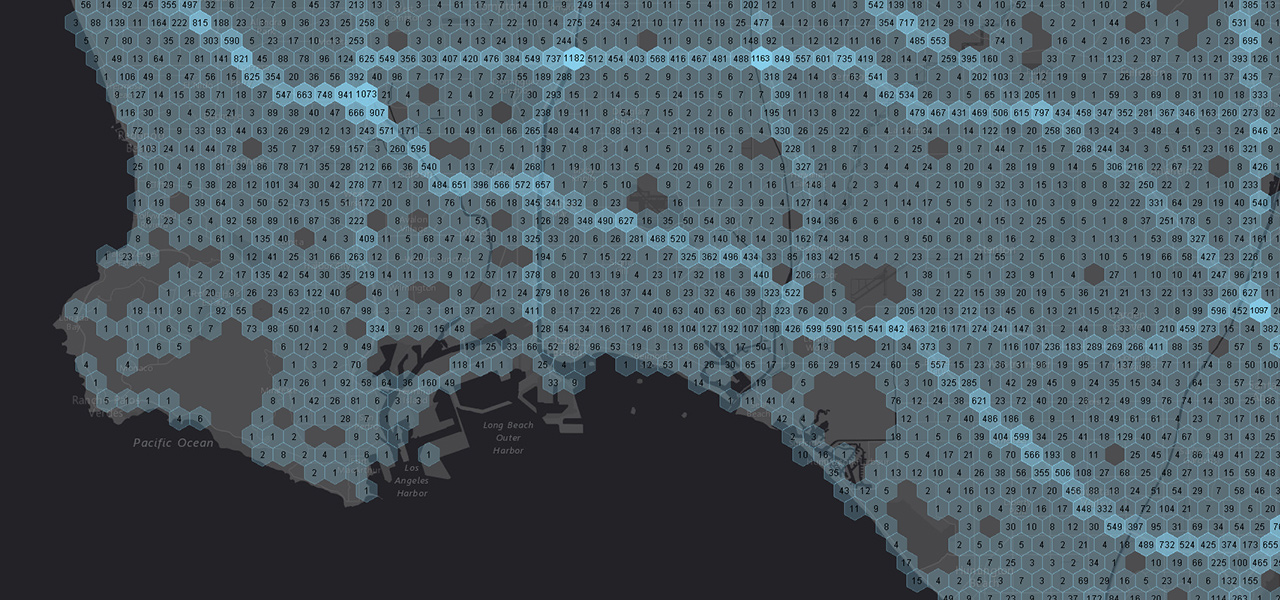
Turn noise into intelligence
Visualize patterns, relationships, anomalies, and incidents in large amounts of data. Leverage ArcGIS GeoAnalytics Server or ArcGIS Velocity to analyze big datasets and visualize insights to make more informed decisions.
Need more information?
Email us
Questions about buying ArcGIS, pricing or need support? Email us at solutions@esribelux.com
Contact customer support
Visit our support page
Call us
Speak with a representative