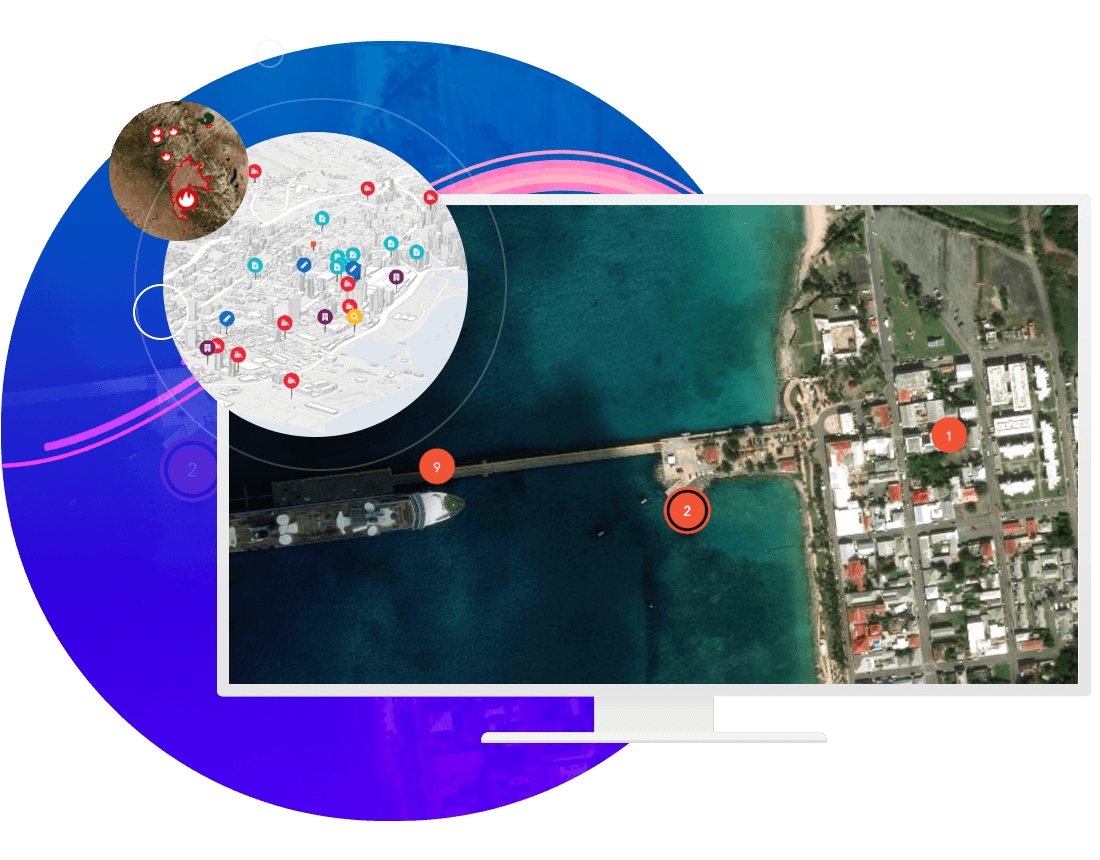
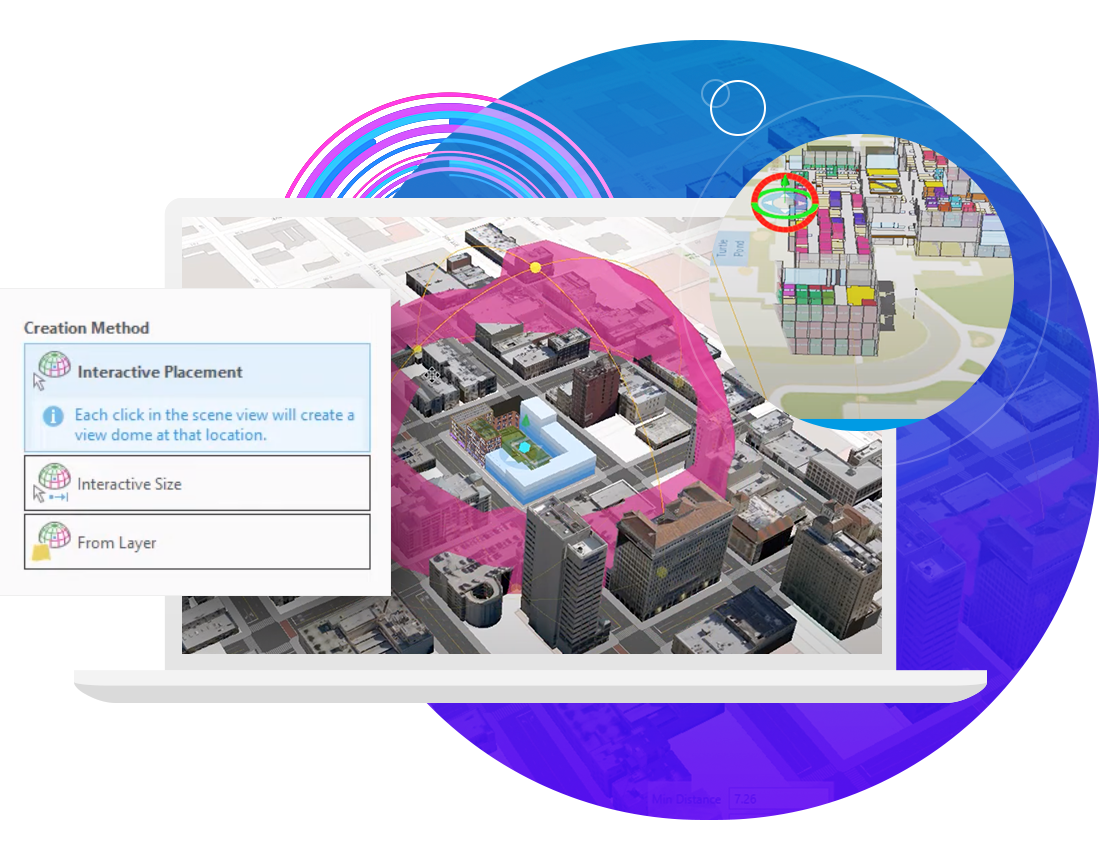
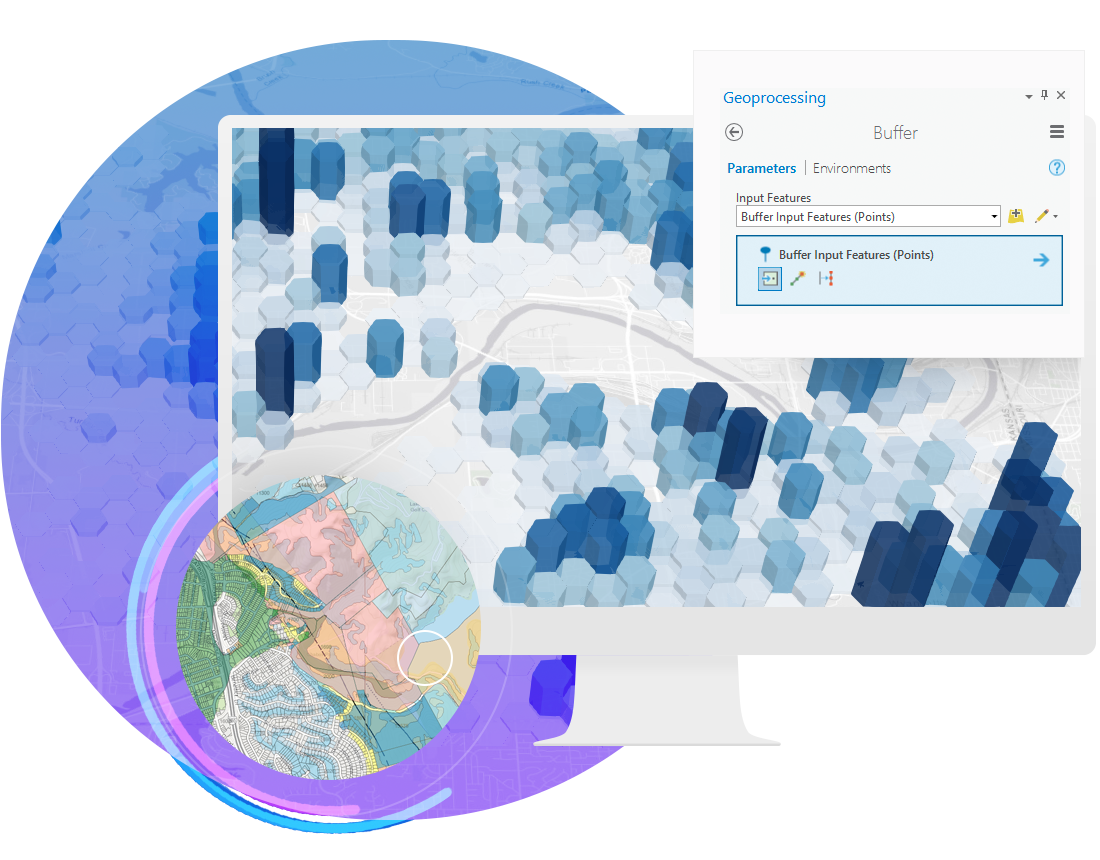
Exploration and Visualization


Manipulate analysis parameters and receive real-time visual feedback

Creating graphics

Graphic elements can be simple geometric shapes—rectangles, circles, lines, or points—or they can be complex polygons, linear or curved text, or images. When a graphics layer is added to a map in ArcGIS Pro, you can create graphic elements in maps and draw them in layout map frames and scenes.

Exploratory analysis

Using exploratory data analysis tools—like Line of Sight, View Dome, and Viewshed—in 3D, you can investigate your data by interactively creating graphics and editing analysis parameters in real time.

Interactive tools

With the interactive tools, you can create analytical objects by clicking in the scene or using input source layers. You can manipulate analysis parameters and receive real-time visual feedback in the scene.

Need more information?

Email us

Questions about buying ArcGIS, pricing or need support? Email us at solutions@esribelux.com

solutions@esribelux.com

Contact customer support

Visit our support page

Visit

Call us

Speak with a representative

32 (0)2 460 74 80